Wednesday, December 29, 2010

AG: Economic Value Added (EVA) - How to Calculate Economic Viability of a Corporation

Economic Value Added is a performance ratio that determines the true economic profitability of a corporation because it factors in net operating income after taxes & interest minus the opportunity cost of capital deployed to earn that net operating income. In other words, Economic Value Added shows whether the financial performance of a company exceeds or is below the minimum required rate of return for shareholders or business lenders. Economic Value Added tells investors whether the amount of capital they have invested in to the business is generating them higher return than their minimum, or if it is better to invest the capital elsewhere. Here is how Economic Value Added (EVA) is used by financial analysts:

i) Economic Value Added is used as a performance evaluation tool of higher level managers, directors, VPs and CEOs of a corporation because the performance of the organization depends on the human resources deployed.

ii) Economic Value Added is used at sub-division level & entire organizational level of the business, unlike other methods such as Market Value Added that only focuses on the big picture of a corporation.

iii) Economic Value Added factors in to performance evaluation that the operating net income of a corporation must cover both operating costs of the organization as well as the capital costs (opportunity cost of capital). This is unlike other accounting methods such as EBIT or EBITDA or Net Income that look at total revenues generated by the business minus total expenses as a performance evaluation tool.

AG: Value-Added Production

When resources are exported in raw form, without economic value being added, they contribute very little to the stability and diversity of local economies.

Resource-dependent communities have historically captured little of the enormous wealth that has flowed through them. They have simply extracted raw materials, creating relatively few jobs while remaining at the mercy of external market forces and owners. Most of the economic value has been generated elsewhere.

In contrast, local economies are able to turn raw resources, both local and imported, into a wide range of products and services. Such economies can effectively harness skilled labor and specialized equipment to add many layers of value to every tree, fish, mineral, or crop. They provide more economic activity — and therefore more jobs — per unit of resource, decreasing pressure on nature and enhancing social equity.

Timbre Tonewood, based on Vancouver Island, provides an excellent example of value-added production. The company, which makes spruce and cedar guitar tops, carefully evaluates every piece of wood that comes through its mill. Based on their appearance, the dried planks are sorted into nine different grades, ranging from the low-end tops, which will probably be painted, to the very best — distinguished by their creamy color, their even ring pattern, and rays running across the grain.

Timbre Tonewood's by-products feed the local economy as well. A local box-maker uses some of the pieces that are too small or irregular to be made into guitar tops for smoked salmon cases. Using waste as resource, another local entrepreneur blends the sawdust from the operation with shrimp shells to make compost.

Value-added products have also been developed from timber (including flooring, lumber, furniture, crafts, etc.), seafood (premium products created through careful processing and decreasing time to market), agriculture (specialty products like jams, sauces, packaged foods), and many other sources.

Add value locally by careful application of appropriate skills and equipment, creating additional jobs without increasing the strain on ecosystems. This helps maintain a stable and diverse local economy

AG: EVA, SVA, and the Economy

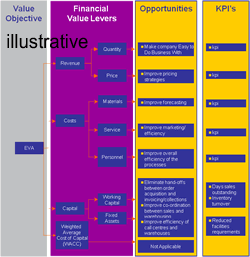
While at Accenture, one of our analytical tools was Shareholder Value Analysis (SVA) – a tool based on Economic Value Added. The premise is that by looking at a company’s financials, we can determine where to best target our innovation efforts. The analysis can show us, for example, if reducing SG&A will have a greater impact on EVA than, let’s say, COGS. It will tell us the impact on EVA if we increase sales by a certain amount. It is a very powerful tool. You can see the general model by clicking the image on the right. The analysis is obviously a lot more complex.

This model works nicely in good times. But does it work today? What is it telling us?

I asked two of my ex-Accenture colleagues who are experts on SVA the following question:

Cost of Capital is part of the EVA equation. Given the credit crisis, how has this impacted EVA? Is cost of capital going up? If so, what does that mean in terms of where companies should invest then efforts? Or is it going down because the prime rate is so low? What does this mean that from a targeting perspective?

Here are the two responses:

Response #1: On the EVA question, theoretically the Cost of Capital is down given the prime. But actually it’s up given the credit markets — the Libor is a good proxy (the rate at which banks lend to each other). The B2B rates are even worse, hence all the talk about the credit markets freezing up. In terms of targeting Cost of Capital, that’s a tougher question. Most of the action in EVA around the Weighted Average Cost of Capital (WACC) is related to more or less leverage. So targeting it would mean more leverage and there’s not too many companies that want to go in this direction now. In fact, we may have determined a “ceiling” on how far you can push on that lever.

Response #2: From a mathematical perspective, marginal cost of capital is fairly low these days. The availability of capital, however, is the real issue. In the current market it is difficult to raise capital. Therefore if an enterprise can generate excess cash and can identify opportunities with good returns they should certainly invest. It is no different for an individual. Assuming that a major catastrophe is not looming on the horizon and assuming that one has available cash, this is the time to invest. I should hasten to add that the “classical” capital market theories upon which WACC and EVA are based are NOT, in my opinion, quite valid in a tumultuous market where risk free rates are almost zero and people are simply keeping cash “under the mattress.”

Interesting thoughts.

My follow up question is, “Assumiung WACC is up, what is the relative impact of cost reduction versus revenue growth on EVA?”

What do you think? I’d love to get many different perspectives on this topic.

AG: Economic Value Added: The Practitioner’s Guide to a Measurement and Management Framework: Craig Savarese

The shareholder value creation philosophy is a central element in many companies’ financial management practices. A widely adopted approach to measuring financial performance and managing for value creation is economic profit (economic value added). A deceptively simple concept, companies often are not prepared for the challenges and issues they need to consider when measuring economic profit, nor for how to incorporate it into financial management practices. This book addresses these challenges by: developing a framework for linking economic profit to shareholder value; explaining the issues relevant to developing a company-specific economic profit measure; and demonstrating how to incorporate economic profit into financial management practices. The book is about practical application - designed as a user’s guide - so that you can apply shareholder value principles and understand the implications for your business. It shows how economic profit links to shareholder value, and dispels commonly cited myths about adopting a shareholder value framework to drive a company’s financial management practices. It is aimed at financial managers and accounting professionals, managers, consultants and equity analysts who want to understand the application of shareholder value.

Tuesday, December 28, 2010

AG: Economic Contributions - 2008 Performance

The economic contribution we make to society is much more than the financial profits we derive. Our contribution includes the value that flows from the broader contributions of our operations, such as payments to our employees and suppliers and disbursements to governments, including taxes and royalties.

The following provides an outline of:

Our Financial Performance
The broader economic contributions we make to society through our Economic Value Generated and Distributed.

Economic Value Generated and Distributed

Economic value generated and distributed, as defined in the Global Reporting Initiative (2006 version), provides an economic profile or context of the reporting organisation and a useful picture of direct monetary value added to regional economies.
The measure includes revenues, operating costs, employee compensation, donations and other community investments, retained earnings, and payments to capital providers and to governments. The breakdown of this amount by category is presented below and shows expenditure by region to help to quantify the regional economic contributions of the Company. Refer table below.

Extractive Industries Transparency Initiative

The Extractive Industries Transparency Initiative (EITI) is gaining momentum as an international initiative bringing together companies, investors, governments, international financial institutions and civil society to improve disclosure and tracking of revenues in developing countries.

We remain supportive of EITI but note that implementation in the countries where we operate has not yet progressed to the point where an appropriate framework for reporting is in place. We remain committed to constructive engagement with our host governments as they seek to progress implementation.

Thursday, December 16, 2010

AG: Auto's Continue Rebound


Source: Autoblog

AG: ISM Manufacturing Up for 20th Straight Month

Marketwatch details:

Conditions for the nation's manufacturers improved for the 20th straight month, the Institute for Supply Management reported Tuesday. The ISM index rose to 60.8% in January from 58.5% in December. This is the highest level of the factory index since last May. The report was much stronger than expected. The consensus forecast of estimates collected by MarketWatch was for the index to remain steady at 58.5%.
Readings above 50 indicate expansion. Below the headline, the report was also strong. The key employment index improved to 61.7% in January from 58.9% in December. New orders jumped to 67.8% in January from 62% in the prior month. Input prices soared in January. The price index jumped to 81.5 from 72.5 in the prior month.


Source: ISM

Sunday, December 5, 2010

AG: Productivity Continues Hot Streak

Bloomberg details (bold mine):
The productivity of U.S. workers unexpectedly increased in the fourth quarter at a faster rate as companies sought to contain costs.

The measure of employee output per hour rose at a 2.6 percent annual rate, compared with a revised 2.4 percent gain in the previous three months, figures from the Labor Department showed today in Washington. Economists projected a 2 percent advance, according to the median forecast in a Bloomberg News survey. Labor expenses fell for fifth time in six quarters.

“There is a good chance that productivity will slow further this year, as firms are increasingly forced to hire more workers to expand output,” Paul shworth, chief U.S. economist at Capital Economics Ltd. in Toronto, said in a note to clients. “That is good news for the unemployed.”


Source: BLS