Thursday, November 25, 2010

AG: Dividend vs. Buyback Yield... The Importance of Timing

Professor Damodaran (via World Beta and Abnormal Returns):

S&P's most recent update indicates that US companies, after a pause for about a year after the banking crisis, are back in the buyback game. In the third quarter of 2010, the S&P 500 companies bought back almost $ 80 billion of stock, up 128% from the third quarter of 2009.The below chart shows the dividend yield (dividends divided by the S&P 500's market cap) and buyback yield (buybacks divided by the S&P 500's market cap) on a quarterly basis (annualized) going back to 2004.


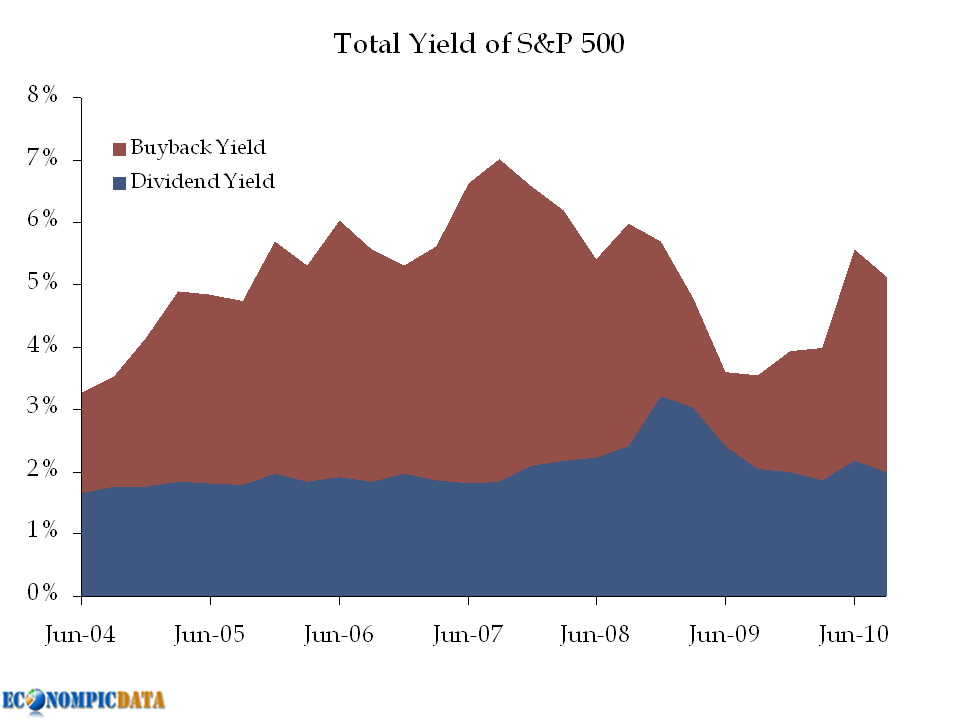
While getting cash back to shareholders is the whole point of investing in stocks (timing of returning that cash is potentially a broader question), the higher buyback yield is not necessarily a great thing; it is a great thing if the cash is buying back stock when cheap... not when expensive. And when were corporations buying back the most? Q2 and Q3 2007 (i.e. the market peak). The lowest? Q1 and Q2 2009 (i.e. the market trough).

Professor Damodaran does provide some rationale / discussion into why the trend has moved to buyback vs. dividend:
  • Manager compensation: buybacks increase the price of stock for manager option grants
  • Uncertainty about earnings: buybacks are a lot more flexible than a steady dividend
  • Changing investor profiles: investors that are more focused on stock price
  • Higher earnings per share: less shares outstanding = more earnings per share
Source: S&P

Wednesday, November 24, 2010

AG: Consumer Confidence Improves in January

Marktetwatch details:

An index of U.S. consumer confidence jumped to 60.6 in January, reaching the highest level since May, with more consumers optimistic about income and jobs, as well as current business conditions, the Conference Board reported Tuesday. Note that this does not mean consumers are confident, just that their confidence has improved. Taking a look at the details behind the index we see an improvement across the board, but from very low levels.


Source: Conference Board

Monday, November 22, 2010

AG: Europe's Industrial Rebound: The Power of Mean Revision

RTT News details:

Eurozone industrial new order growth quickened in November, led by Portugal, Finland and Germany, official figures showed Monday. Industrial orders rose 2.1% month-on-month in November, after rising 1.4% in October, the European Union Statistical office Eurostat said. On an annual basis, industrial order growth accelerated to 19.9% from 14.8% recorded in the preceding month. The rise exceeded the 17.5% increase economists had forecast. The below charts show that much of this is purely a rebound off lows, with a relatively strong relationship between those reporting strong results in 2010 off of lower figures in 2009.


Source: Eurostat

Sunday, November 21, 2010

AG: China Hearts Silver... Market Top?

FT Aphaville reports (via Bullion Vault dealers):

Looking at China’s latest import data, 2010 saw silver imports (net of exports) rise four-fold from 2009 note analysts at Mitsui in London – a total of 3,500 tonnes.
A heavy seller of silver bullion after lifting the state’s 50-year monopoly in 2000, China was a net export of 3,000 tonnes as recently as 2005.


Is this support for the massive 80% year over year jump in the price of silver under the belief that China will continue to be a huge buyer of silver? Or is this a sign that the price is bubblicious and investors should be concerned that China's economy will be forced into slow down mode (thus less net purchases) following the recent strong print in both growth and inflation?

Source: Yahoo Finance

Saturday, November 20, 2010

AG: Housing Market Drives Leading Economic Indicators?

Bloomberg details:

The index of U.S. leading economic indicators increased in December more than forecast, a sign the recovery will gather steam in the new year.

The Conference Board’s gauge of the outlook for the next three to six months rose 1.0 percent after a 1.1 percent gain in November, the New York-based group said today. The December reading, the sixth consecutive monthly increase, exceeded the 0.6 percent gain in the median forecast of economists surveyed.
And the biggest driver of that growth...
  • The improving job market? Nope.
  • The rising equity market? Nope.
  • The steep yield curve? Nope
So what is it? Building permits.


The level of permits in December, excluding the recent downturn, was the lowest figure since records began in 1960 (when the U.S. population was about 40% smaller), yet this was the biggest driver of the leading indicators.

Why?

Addition by the elimination of subtraction.

In other words, it can't get any worse than this, thus it can only get better (much more detail on this over at Calculated Risk).

Source: Conference Board

AG: The Equity Market is in Trouble... J-E-T-S Edition

Floyd Norris (via The Big Picture):

Consider the performance of the Standard & Poor’s 500 in 1969, the year the Jets won their only Super Bowl. It was down 11.4 percent.
Contrast that to the market’s performance after victories by any of the other teams still in contention. The market has never gone down after any of them won the Super Bowl.


Since:

A) The market has "always" gone down when the Jets win
B) The Jets will win (warning: the last time I was this confident they lost by more than 40)
C) The market will go down

Or something like that...

Friday, November 19, 2010

AG: Housing Starts Quite Low

Housing market optimists will blame this partially on December weather. Broader optimists will point out that low levels of new construction will help clear the existing inventory. Those looking for the housing market to contribute towards the economic recovery (outside of addition by the elimination of subtraction) will be disappointed.


Source: Census

Thursday, November 18, 2010

AG: China Still NOT Selling Treasuries

Back in February of last year I detailed that China was NOT selling Treasuries when the "experts" in the media said they were. TIC December 2009 data initially stated Chinese holdings totalled a bit more than $700 billion, down from summer '09 levels. I made the case that these purchases were actually being made through the United Kingdom. They were. The result is that China's December 2009 holdings were revised upward by $200 billion.

"Experts" in the media would have learned their lesson by now right?

To the Financial Times:
China and Russia were the major sellers of US Treasuries in November as bond yields surged sharply higher that month, according to the latest government data.
The US Treasury reported on Tuesday that private investors sought more dollar-denominated stocks and bonds in November than October, offsetting record sales by foreign governments.
The FT was joined by the WSJ, CNN, Marketwatch amongst others getting it wrong.
Facts:

1) Journalist do not read EconomPic
2) China is NOT selling Treasuries


Source: Treasury

AG: Empire Manufacturing Outlook at Seven Year High

Will this be enough for them to spend some of that cash hoard?


Source: NY Fed

AG: Still Too Much Capacity

The below chart shows that capacity utilization in the system is slowly recovering, but remains remain very low.


This in part explains why core inflation remains muted, even with the recent commodity spike.

Source: Federal Reserve / BLS

Monday, November 15, 2010

AG: Odd Month

Justification for the below?
  • Risk on / reflation in the developed world (continued dollar sell-off)
  • Brakes thrown on in emerging market world
  • Sell-off in rates across the board
  • Gold and oil off because... who knows


Source: Google Finance

Sunday, November 14, 2010

AG: Chicago PMI Points to Heating Economy / Input Prices

Bloomberg detailed:

Businesses in the U.S. expanded in January at the fastest pace since July 1988, indicating the world’s largest economy has momentum at the start of the year.

The Institute for Supply Management-Chicago Inc. said today its business barometer rose this month to 68.8 from 66.8 in December. Figures greater than 50 signal expansion, and economists projected the gauge would slip to 64.5, based on the median estimate in a Bloomberg survey.


Source: ISM

Saturday, November 13, 2010

AG: GDP Growth at 3.2% in Q4

Pretty wild release. HUGE positive impact (more than 3%) by improvement in net exports. HUGE positive impact (more than 3%) by consumption (strong demand in durable and non-durable goods). HUGE negative impact (almost 4%) by inventory liquidation to meet final demand vs. new production.


My initial thoughts? I've been looking for a bump in aggregate global demand and the jump in consumption and net exports is a good sign. In addition, the fact that we have met final demand by depleting inventories, once again feeds the cycle that businesses have to ramp up production to meet final demand going forward (which will positively impact future economic growth).

Source: BEA

Friday, November 12, 2010

AG: The Bulldog Bubble

Random? Yes, but I like dogs...

The American Kennel Club (hat tip Skip) details:

This year’s list included some shakeups in the top 10 – the Beagle overtook the Golden Retriever for the 4th spot and the Bulldog, who has been steadily rising up in rank, took 6th place away from the Boxer, who dropped to 7th in 2010.

"Not since the early 20th Century has the Bulldog enjoyed such sustained popularity," said AKC Spokesperson Lisa Peterson. "‘Bob’ was the first AKC registered Bulldog in 1886, and today the breed enjoys its highest ranking in 100 years at number 6."


Source: American Kennel Club

AG: Taking a Look at the Cash Hoarders

The Huffington Post details the top 11 cash hoarders.

Instead of building plants or hiring workers, corporate America is clinging to its cash.Companies are sitting on $1.93 trillion in cash and liquid assets, the highest level since 1959, the Wall Street Journal reports.
With high unemployment and families still limiting their spending, corporate America is backing away from expansion. But with interest rates on the heaps of cash so low, that $1.3 trillion might as well be stuffed in a mattress.
Below is a chart of the cash levels for 10 of the 11 (I excluded GM as they don't have 12 month's of positive earnings), the earnings yield of each company (defined as the inverse of the P/E ratio), and the adjusted earnings yield that backs out the cash from the corporation's market value to determine the earnings power of the company less cash (normally you would have to account some earnings to the cash, but in the current environment, that is minimal).


Note that all cash data is directly from Huffington Post and Google Finance (I did not go through financials) and is presented without analysis or determination as to whether any of the figures should be adjusted for any reason. That said, if the cash is returned to investors via dividend or buyback OR the cash is put to good use, corporations appear cheaper than they might first appear.

Saturday, November 6, 2010

AG: SM Services Growth at Fastest Pace in 5 1/2 Years

ecPulse details:

The Institute for Supply Management released today the ISM services index, where the ISM Services index rose in January to 59.4 from the prior reported estimate of 57.1 and well above the expected estimates of 57.2. The services sector expanded in January at the fastest pace since August 2005.

The business activity index rose to 64.6 from 62.9, while the prices paid index rose to 72.1 from 69.5, new orders increased to 64.9 from 61.4, while the employment index rose to 54.5 from 52.6, new export orders slightly eased to 53.5 from 56.0 and imports increased to 53.5 from 51.0.


Source: ISM

AG: On the Job Non-Recovery

The disappointing jobs data this morning, perhaps due to weather, detailed by Bloomberg:

The U.S. jobless rate unexpectedly fell in January to the lowest level in 21 months, while payroll growth was depressed by winter storms.


Unemployment declined to 9 percent from December’s 9.4 percent, the Labor Department said today in Washington. Employers added 36,000 workers, short of the 146,000 median gain projected by economists in a Bloomberg: News survey.

As we've detailed for some time the improvement in the unemployment rate is due to the denominator (in the unemployed / labor force equation) dropping off a cliff. The chart below details this phenomenon over the past twelve months according to the household survey. As can be seen, jobs are finally being added (~900 thousand), but during a time when the population of working age individuals in the U.S. grew by ~1.9 million. Add in a drop in the labor force (~420k) and you get ~2.3 million MORE individuals than last year that could be working, not working.


We need to do better than this.


Source: BLS

Wednesday, November 3, 2010

AG: European Retail Sales Decline

Reuters details:Euro zone retail sales unexpectedly fell in December with equal declines in food
and non-food sectors, a sign that consumers in the single currency bloc were reluctant to splurge even in the key holiday period.

The European Union's statistics office Eurostat said on Thursday retail sales in the 16 countries using the euro fell by 0.6 percent month-on-month, for a 0.9 percent year-on-year decline.

Economists polled by Reuters had expected a 0.5 percent month-on-month rise and a 0.2 percent increase year-on-year.
The new data came while European Central Bank policymakers met to decide on interest rates. Economists said they did not expect weak retail sales to prevent the ECB from issuing a warning on inflationary pressures.
The chart below shows the three month change by country and clearly shows the slowdown in aggregate demand within the region.


Source: Eurostat