Wednesday, December 29, 2010

AG: Economic Value Added (EVA) - How to Calculate Economic Viability of a Corporation

Economic Value Added is a performance ratio that determines the true economic profitability of a corporation because it factors in net operating income after taxes & interest minus the opportunity cost of capital deployed to earn that net operating income. In other words, Economic Value Added shows whether the financial performance of a company exceeds or is below the minimum required rate of return for shareholders or business lenders. Economic Value Added tells investors whether the amount of capital they have invested in to the business is generating them higher return than their minimum, or if it is better to invest the capital elsewhere. Here is how Economic Value Added (EVA) is used by financial analysts:

i) Economic Value Added is used as a performance evaluation tool of higher level managers, directors, VPs and CEOs of a corporation because the performance of the organization depends on the human resources deployed.

ii) Economic Value Added is used at sub-division level & entire organizational level of the business, unlike other methods such as Market Value Added that only focuses on the big picture of a corporation.

iii) Economic Value Added factors in to performance evaluation that the operating net income of a corporation must cover both operating costs of the organization as well as the capital costs (opportunity cost of capital). This is unlike other accounting methods such as EBIT or EBITDA or Net Income that look at total revenues generated by the business minus total expenses as a performance evaluation tool.

AG: Value-Added Production

When resources are exported in raw form, without economic value being added, they contribute very little to the stability and diversity of local economies.

Resource-dependent communities have historically captured little of the enormous wealth that has flowed through them. They have simply extracted raw materials, creating relatively few jobs while remaining at the mercy of external market forces and owners. Most of the economic value has been generated elsewhere.

In contrast, local economies are able to turn raw resources, both local and imported, into a wide range of products and services. Such economies can effectively harness skilled labor and specialized equipment to add many layers of value to every tree, fish, mineral, or crop. They provide more economic activity — and therefore more jobs — per unit of resource, decreasing pressure on nature and enhancing social equity.

Timbre Tonewood, based on Vancouver Island, provides an excellent example of value-added production. The company, which makes spruce and cedar guitar tops, carefully evaluates every piece of wood that comes through its mill. Based on their appearance, the dried planks are sorted into nine different grades, ranging from the low-end tops, which will probably be painted, to the very best — distinguished by their creamy color, their even ring pattern, and rays running across the grain.

Timbre Tonewood's by-products feed the local economy as well. A local box-maker uses some of the pieces that are too small or irregular to be made into guitar tops for smoked salmon cases. Using waste as resource, another local entrepreneur blends the sawdust from the operation with shrimp shells to make compost.

Value-added products have also been developed from timber (including flooring, lumber, furniture, crafts, etc.), seafood (premium products created through careful processing and decreasing time to market), agriculture (specialty products like jams, sauces, packaged foods), and many other sources.

Add value locally by careful application of appropriate skills and equipment, creating additional jobs without increasing the strain on ecosystems. This helps maintain a stable and diverse local economy

AG: EVA, SVA, and the Economy

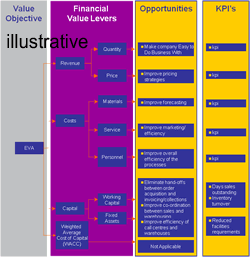
While at Accenture, one of our analytical tools was Shareholder Value Analysis (SVA) – a tool based on Economic Value Added. The premise is that by looking at a company’s financials, we can determine where to best target our innovation efforts. The analysis can show us, for example, if reducing SG&A will have a greater impact on EVA than, let’s say, COGS. It will tell us the impact on EVA if we increase sales by a certain amount. It is a very powerful tool. You can see the general model by clicking the image on the right. The analysis is obviously a lot more complex.

This model works nicely in good times. But does it work today? What is it telling us?

I asked two of my ex-Accenture colleagues who are experts on SVA the following question:

Cost of Capital is part of the EVA equation. Given the credit crisis, how has this impacted EVA? Is cost of capital going up? If so, what does that mean in terms of where companies should invest then efforts? Or is it going down because the prime rate is so low? What does this mean that from a targeting perspective?

Here are the two responses:

Response #1: On the EVA question, theoretically the Cost of Capital is down given the prime. But actually it’s up given the credit markets — the Libor is a good proxy (the rate at which banks lend to each other). The B2B rates are even worse, hence all the talk about the credit markets freezing up. In terms of targeting Cost of Capital, that’s a tougher question. Most of the action in EVA around the Weighted Average Cost of Capital (WACC) is related to more or less leverage. So targeting it would mean more leverage and there’s not too many companies that want to go in this direction now. In fact, we may have determined a “ceiling” on how far you can push on that lever.

Response #2: From a mathematical perspective, marginal cost of capital is fairly low these days. The availability of capital, however, is the real issue. In the current market it is difficult to raise capital. Therefore if an enterprise can generate excess cash and can identify opportunities with good returns they should certainly invest. It is no different for an individual. Assuming that a major catastrophe is not looming on the horizon and assuming that one has available cash, this is the time to invest. I should hasten to add that the “classical” capital market theories upon which WACC and EVA are based are NOT, in my opinion, quite valid in a tumultuous market where risk free rates are almost zero and people are simply keeping cash “under the mattress.”

Interesting thoughts.

My follow up question is, “Assumiung WACC is up, what is the relative impact of cost reduction versus revenue growth on EVA?”

What do you think? I’d love to get many different perspectives on this topic.

AG: Economic Value Added: The Practitioner’s Guide to a Measurement and Management Framework: Craig Savarese

The shareholder value creation philosophy is a central element in many companies’ financial management practices. A widely adopted approach to measuring financial performance and managing for value creation is economic profit (economic value added). A deceptively simple concept, companies often are not prepared for the challenges and issues they need to consider when measuring economic profit, nor for how to incorporate it into financial management practices. This book addresses these challenges by: developing a framework for linking economic profit to shareholder value; explaining the issues relevant to developing a company-specific economic profit measure; and demonstrating how to incorporate economic profit into financial management practices. The book is about practical application - designed as a user’s guide - so that you can apply shareholder value principles and understand the implications for your business. It shows how economic profit links to shareholder value, and dispels commonly cited myths about adopting a shareholder value framework to drive a company’s financial management practices. It is aimed at financial managers and accounting professionals, managers, consultants and equity analysts who want to understand the application of shareholder value.

Tuesday, December 28, 2010

AG: Economic Contributions - 2008 Performance

The economic contribution we make to society is much more than the financial profits we derive. Our contribution includes the value that flows from the broader contributions of our operations, such as payments to our employees and suppliers and disbursements to governments, including taxes and royalties.

The following provides an outline of:

Our Financial Performance
The broader economic contributions we make to society through our Economic Value Generated and Distributed.

Economic Value Generated and Distributed

Economic value generated and distributed, as defined in the Global Reporting Initiative (2006 version), provides an economic profile or context of the reporting organisation and a useful picture of direct monetary value added to regional economies.
The measure includes revenues, operating costs, employee compensation, donations and other community investments, retained earnings, and payments to capital providers and to governments. The breakdown of this amount by category is presented below and shows expenditure by region to help to quantify the regional economic contributions of the Company. Refer table below.

Extractive Industries Transparency Initiative

The Extractive Industries Transparency Initiative (EITI) is gaining momentum as an international initiative bringing together companies, investors, governments, international financial institutions and civil society to improve disclosure and tracking of revenues in developing countries.

We remain supportive of EITI but note that implementation in the countries where we operate has not yet progressed to the point where an appropriate framework for reporting is in place. We remain committed to constructive engagement with our host governments as they seek to progress implementation.

Thursday, December 16, 2010

AG: Auto's Continue Rebound


Source: Autoblog

AG: ISM Manufacturing Up for 20th Straight Month

Marketwatch details:

Conditions for the nation's manufacturers improved for the 20th straight month, the Institute for Supply Management reported Tuesday. The ISM index rose to 60.8% in January from 58.5% in December. This is the highest level of the factory index since last May. The report was much stronger than expected. The consensus forecast of estimates collected by MarketWatch was for the index to remain steady at 58.5%.
Readings above 50 indicate expansion. Below the headline, the report was also strong. The key employment index improved to 61.7% in January from 58.9% in December. New orders jumped to 67.8% in January from 62% in the prior month. Input prices soared in January. The price index jumped to 81.5 from 72.5 in the prior month.


Source: ISM

Sunday, December 5, 2010

AG: Productivity Continues Hot Streak

Bloomberg details (bold mine):
The productivity of U.S. workers unexpectedly increased in the fourth quarter at a faster rate as companies sought to contain costs.

The measure of employee output per hour rose at a 2.6 percent annual rate, compared with a revised 2.4 percent gain in the previous three months, figures from the Labor Department showed today in Washington. Economists projected a 2 percent advance, according to the median forecast in a Bloomberg News survey. Labor expenses fell for fifth time in six quarters.

“There is a good chance that productivity will slow further this year, as firms are increasingly forced to hire more workers to expand output,” Paul shworth, chief U.S. economist at Capital Economics Ltd. in Toronto, said in a note to clients. “That is good news for the unemployed.”


Source: BLS

Thursday, November 25, 2010

AG: Dividend vs. Buyback Yield... The Importance of Timing

Professor Damodaran (via World Beta and Abnormal Returns):

S&P's most recent update indicates that US companies, after a pause for about a year after the banking crisis, are back in the buyback game. In the third quarter of 2010, the S&P 500 companies bought back almost $ 80 billion of stock, up 128% from the third quarter of 2009.The below chart shows the dividend yield (dividends divided by the S&P 500's market cap) and buyback yield (buybacks divided by the S&P 500's market cap) on a quarterly basis (annualized) going back to 2004.


While getting cash back to shareholders is the whole point of investing in stocks (timing of returning that cash is potentially a broader question), the higher buyback yield is not necessarily a great thing; it is a great thing if the cash is buying back stock when cheap... not when expensive. And when were corporations buying back the most? Q2 and Q3 2007 (i.e. the market peak). The lowest? Q1 and Q2 2009 (i.e. the market trough).

Professor Damodaran does provide some rationale / discussion into why the trend has moved to buyback vs. dividend:
  • Manager compensation: buybacks increase the price of stock for manager option grants
  • Uncertainty about earnings: buybacks are a lot more flexible than a steady dividend
  • Changing investor profiles: investors that are more focused on stock price
  • Higher earnings per share: less shares outstanding = more earnings per share
Source: S&P

Wednesday, November 24, 2010

AG: Consumer Confidence Improves in January

Marktetwatch details:

An index of U.S. consumer confidence jumped to 60.6 in January, reaching the highest level since May, with more consumers optimistic about income and jobs, as well as current business conditions, the Conference Board reported Tuesday. Note that this does not mean consumers are confident, just that their confidence has improved. Taking a look at the details behind the index we see an improvement across the board, but from very low levels.


Source: Conference Board

Monday, November 22, 2010

AG: Europe's Industrial Rebound: The Power of Mean Revision

RTT News details:

Eurozone industrial new order growth quickened in November, led by Portugal, Finland and Germany, official figures showed Monday. Industrial orders rose 2.1% month-on-month in November, after rising 1.4% in October, the European Union Statistical office Eurostat said. On an annual basis, industrial order growth accelerated to 19.9% from 14.8% recorded in the preceding month. The rise exceeded the 17.5% increase economists had forecast. The below charts show that much of this is purely a rebound off lows, with a relatively strong relationship between those reporting strong results in 2010 off of lower figures in 2009.


Source: Eurostat

Sunday, November 21, 2010

AG: China Hearts Silver... Market Top?

FT Aphaville reports (via Bullion Vault dealers):

Looking at China’s latest import data, 2010 saw silver imports (net of exports) rise four-fold from 2009 note analysts at Mitsui in London – a total of 3,500 tonnes.
A heavy seller of silver bullion after lifting the state’s 50-year monopoly in 2000, China was a net export of 3,000 tonnes as recently as 2005.


Is this support for the massive 80% year over year jump in the price of silver under the belief that China will continue to be a huge buyer of silver? Or is this a sign that the price is bubblicious and investors should be concerned that China's economy will be forced into slow down mode (thus less net purchases) following the recent strong print in both growth and inflation?

Source: Yahoo Finance

Saturday, November 20, 2010

AG: Housing Market Drives Leading Economic Indicators?

Bloomberg details:

The index of U.S. leading economic indicators increased in December more than forecast, a sign the recovery will gather steam in the new year.

The Conference Board’s gauge of the outlook for the next three to six months rose 1.0 percent after a 1.1 percent gain in November, the New York-based group said today. The December reading, the sixth consecutive monthly increase, exceeded the 0.6 percent gain in the median forecast of economists surveyed.
And the biggest driver of that growth...
  • The improving job market? Nope.
  • The rising equity market? Nope.
  • The steep yield curve? Nope
So what is it? Building permits.


The level of permits in December, excluding the recent downturn, was the lowest figure since records began in 1960 (when the U.S. population was about 40% smaller), yet this was the biggest driver of the leading indicators.

Why?

Addition by the elimination of subtraction.

In other words, it can't get any worse than this, thus it can only get better (much more detail on this over at Calculated Risk).

Source: Conference Board

AG: The Equity Market is in Trouble... J-E-T-S Edition

Floyd Norris (via The Big Picture):

Consider the performance of the Standard & Poor’s 500 in 1969, the year the Jets won their only Super Bowl. It was down 11.4 percent.
Contrast that to the market’s performance after victories by any of the other teams still in contention. The market has never gone down after any of them won the Super Bowl.


Since:

A) The market has "always" gone down when the Jets win
B) The Jets will win (warning: the last time I was this confident they lost by more than 40)
C) The market will go down

Or something like that...

Friday, November 19, 2010

AG: Housing Starts Quite Low

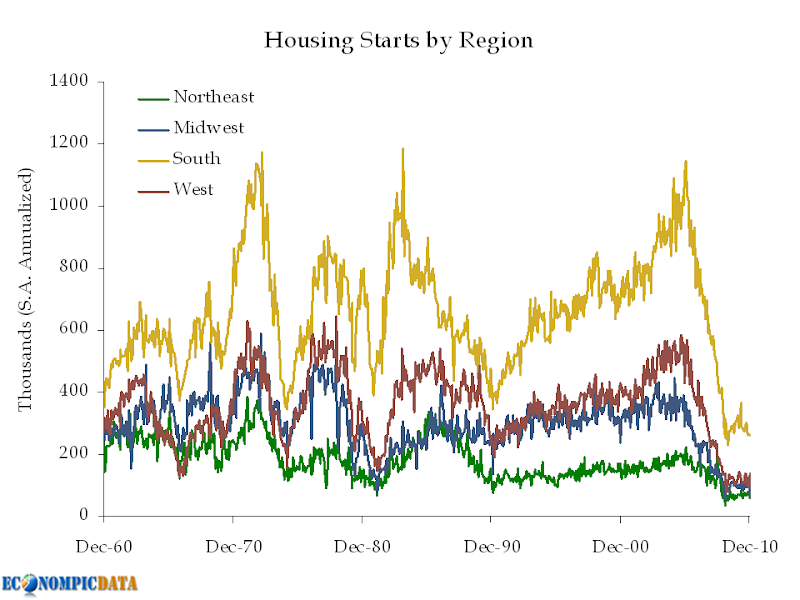
Housing market optimists will blame this partially on December weather. Broader optimists will point out that low levels of new construction will help clear the existing inventory. Those looking for the housing market to contribute towards the economic recovery (outside of addition by the elimination of subtraction) will be disappointed.


Source: Census

Thursday, November 18, 2010

AG: China Still NOT Selling Treasuries

Back in February of last year I detailed that China was NOT selling Treasuries when the "experts" in the media said they were. TIC December 2009 data initially stated Chinese holdings totalled a bit more than $700 billion, down from summer '09 levels. I made the case that these purchases were actually being made through the United Kingdom. They were. The result is that China's December 2009 holdings were revised upward by $200 billion.

"Experts" in the media would have learned their lesson by now right?

To the Financial Times:
China and Russia were the major sellers of US Treasuries in November as bond yields surged sharply higher that month, according to the latest government data.
The US Treasury reported on Tuesday that private investors sought more dollar-denominated stocks and bonds in November than October, offsetting record sales by foreign governments.
The FT was joined by the WSJ, CNN, Marketwatch amongst others getting it wrong.
Facts:

1) Journalist do not read EconomPic
2) China is NOT selling Treasuries


Source: Treasury

AG: Empire Manufacturing Outlook at Seven Year High

Will this be enough for them to spend some of that cash hoard?


Source: NY Fed

AG: Still Too Much Capacity

The below chart shows that capacity utilization in the system is slowly recovering, but remains remain very low.


This in part explains why core inflation remains muted, even with the recent commodity spike.

Source: Federal Reserve / BLS

Monday, November 15, 2010

AG: Odd Month

Justification for the below?
  • Risk on / reflation in the developed world (continued dollar sell-off)
  • Brakes thrown on in emerging market world
  • Sell-off in rates across the board
  • Gold and oil off because... who knows


Source: Google Finance

Sunday, November 14, 2010

AG: Chicago PMI Points to Heating Economy / Input Prices

Bloomberg detailed:

Businesses in the U.S. expanded in January at the fastest pace since July 1988, indicating the world’s largest economy has momentum at the start of the year.

The Institute for Supply Management-Chicago Inc. said today its business barometer rose this month to 68.8 from 66.8 in December. Figures greater than 50 signal expansion, and economists projected the gauge would slip to 64.5, based on the median estimate in a Bloomberg survey.


Source: ISM

Saturday, November 13, 2010

AG: GDP Growth at 3.2% in Q4

Pretty wild release. HUGE positive impact (more than 3%) by improvement in net exports. HUGE positive impact (more than 3%) by consumption (strong demand in durable and non-durable goods). HUGE negative impact (almost 4%) by inventory liquidation to meet final demand vs. new production.


My initial thoughts? I've been looking for a bump in aggregate global demand and the jump in consumption and net exports is a good sign. In addition, the fact that we have met final demand by depleting inventories, once again feeds the cycle that businesses have to ramp up production to meet final demand going forward (which will positively impact future economic growth).

Source: BEA

Friday, November 12, 2010

AG: The Bulldog Bubble

Random? Yes, but I like dogs...

The American Kennel Club (hat tip Skip) details:

This year’s list included some shakeups in the top 10 – the Beagle overtook the Golden Retriever for the 4th spot and the Bulldog, who has been steadily rising up in rank, took 6th place away from the Boxer, who dropped to 7th in 2010.

"Not since the early 20th Century has the Bulldog enjoyed such sustained popularity," said AKC Spokesperson Lisa Peterson. "‘Bob’ was the first AKC registered Bulldog in 1886, and today the breed enjoys its highest ranking in 100 years at number 6."


Source: American Kennel Club

AG: Taking a Look at the Cash Hoarders

The Huffington Post details the top 11 cash hoarders.

Instead of building plants or hiring workers, corporate America is clinging to its cash.Companies are sitting on $1.93 trillion in cash and liquid assets, the highest level since 1959, the Wall Street Journal reports.
With high unemployment and families still limiting their spending, corporate America is backing away from expansion. But with interest rates on the heaps of cash so low, that $1.3 trillion might as well be stuffed in a mattress.
Below is a chart of the cash levels for 10 of the 11 (I excluded GM as they don't have 12 month's of positive earnings), the earnings yield of each company (defined as the inverse of the P/E ratio), and the adjusted earnings yield that backs out the cash from the corporation's market value to determine the earnings power of the company less cash (normally you would have to account some earnings to the cash, but in the current environment, that is minimal).


Note that all cash data is directly from Huffington Post and Google Finance (I did not go through financials) and is presented without analysis or determination as to whether any of the figures should be adjusted for any reason. That said, if the cash is returned to investors via dividend or buyback OR the cash is put to good use, corporations appear cheaper than they might first appear.

Saturday, November 6, 2010

AG: SM Services Growth at Fastest Pace in 5 1/2 Years

ecPulse details:

The Institute for Supply Management released today the ISM services index, where the ISM Services index rose in January to 59.4 from the prior reported estimate of 57.1 and well above the expected estimates of 57.2. The services sector expanded in January at the fastest pace since August 2005.

The business activity index rose to 64.6 from 62.9, while the prices paid index rose to 72.1 from 69.5, new orders increased to 64.9 from 61.4, while the employment index rose to 54.5 from 52.6, new export orders slightly eased to 53.5 from 56.0 and imports increased to 53.5 from 51.0.


Source: ISM

AG: On the Job Non-Recovery

The disappointing jobs data this morning, perhaps due to weather, detailed by Bloomberg:

The U.S. jobless rate unexpectedly fell in January to the lowest level in 21 months, while payroll growth was depressed by winter storms.


Unemployment declined to 9 percent from December’s 9.4 percent, the Labor Department said today in Washington. Employers added 36,000 workers, short of the 146,000 median gain projected by economists in a Bloomberg: News survey.

As we've detailed for some time the improvement in the unemployment rate is due to the denominator (in the unemployed / labor force equation) dropping off a cliff. The chart below details this phenomenon over the past twelve months according to the household survey. As can be seen, jobs are finally being added (~900 thousand), but during a time when the population of working age individuals in the U.S. grew by ~1.9 million. Add in a drop in the labor force (~420k) and you get ~2.3 million MORE individuals than last year that could be working, not working.


We need to do better than this.


Source: BLS

Wednesday, November 3, 2010

AG: European Retail Sales Decline

Reuters details:Euro zone retail sales unexpectedly fell in December with equal declines in food
and non-food sectors, a sign that consumers in the single currency bloc were reluctant to splurge even in the key holiday period.

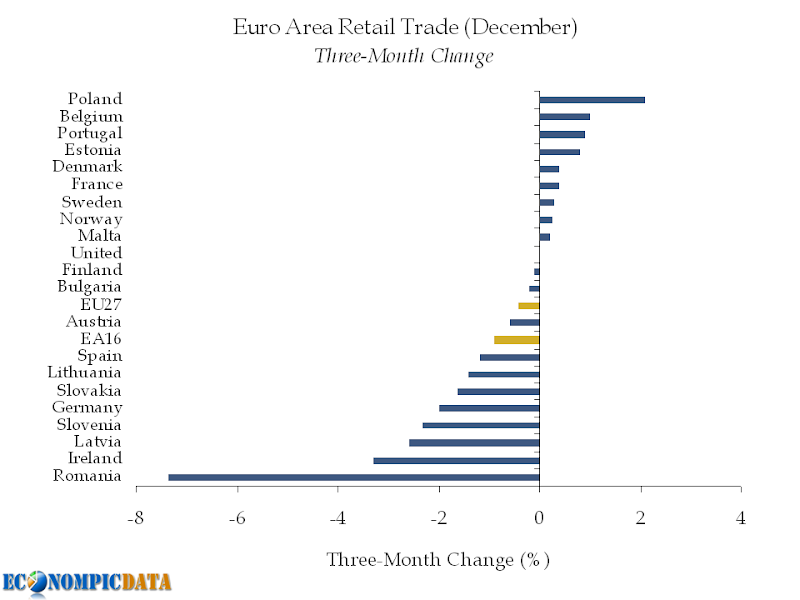
The European Union's statistics office Eurostat said on Thursday retail sales in the 16 countries using the euro fell by 0.6 percent month-on-month, for a 0.9 percent year-on-year decline.

Economists polled by Reuters had expected a 0.5 percent month-on-month rise and a 0.2 percent increase year-on-year.
The new data came while European Central Bank policymakers met to decide on interest rates. Economists said they did not expect weak retail sales to prevent the ECB from issuing a warning on inflationary pressures.
The chart below shows the three month change by country and clearly shows the slowdown in aggregate demand within the region.


Source: Eurostat

Sunday, September 19, 2010

AG: 2007 Ontario Economic Outlook and Fiscal Review

Introduction

The Ontario economy has proven remarkably strong and resilient in the face of an increasingly challenging global economic environment. Since 2002, higher oil prices, a high Canadian dollar and increased competition from newly industrializing countries have tested Ontario businesses’ ability to compete and thrive. More recently, businesses have felt further pressure due to a slowing U.S. economy.

Despite these adverse developments, Ontario has seen continued strong job creation and business investment. Incomes are on the rise and the standard of living is one of the highest in the world. Ontario’s economic growth continues to exceed expectations. Private-sector forecasts of Ontario’s 2007 real gross domestic product (GDP) growth now average 2.0 per cent, up from 1.7 per cent at the time of the 2007 Ontario Budget.

The clearest sign of the Ontario economy’s resilience has been its job creation record. Since October 2003, 417,900 net new jobs have been created. Over 95 per cent of these jobs were in occupations that paid on average over $19.50 per hour, including jobs in natural and applied sciences, management, social sciences, and education.

Still, challenges remain. This strong job creation has not occurred across all sectors of the economy, and many families and communities have been affected by job losses. While total service-sector jobs (private and broader public sectors) have expanded by 10.8 per cent since October 2003, employment in the goods-producing sector has contracted.

There are continued risks on the horizon. The weakened outlook for the U.S. economy, higher oil prices and the stronger Canadian dollar have reduced private-sector Ontario economic growth projections since the time of the 2007 Budget. This also means greater pressure on Ontario businesses over the next few years as they adapt to a much more challenging economic environment.
Investments for a Stronger Ontario

The Ontario Government is taking immediate action to further strengthen Ontario’s economic advantage and help the manufacturing, forestry, agriculture and tourism industries weather economic challenges. The government’s investment strategy builds on its five-point economic plan set out in the 2007 campaign platform, Moving Forward Together. In particular, the government is taking immediate action to keep taxes competitive, support innovation and accelerate its investment in infrastructure.

Measures announced in the 2007 Ontario Economic Outlook and Fiscal Review will boost Ontario’s ability to compete in the global economy by:

enhancing competitiveness through immediate tax reductions
investing in people and communities
investing in infrastructure.

In this document, the government is announcing more than $3 billion in new investments and tax reductions. These actions will boost Ontario employment by about 30,000 jobs over the next three years.
1. Enhancing Competitiveness through immediate tax reductions

The Province is proposing important new tax measures that support manufacturers and other sectors in Ontario challenged by current economic conditions. They would help Ontario manufacturers invest in their own businesses, creating and preserving jobs.

These new measures, totalling $1.1 billion in tax reductions over three years, include:

eliminating Capital Tax on January 1, 2008 for corporations primarily engaged in manufacturing and resource activities
providing a 21 per cent Capital Tax rate cut for all businesses retroactive to January 1, 2007, on the way to full elimination in 2010
increasing the small business deduction threshold to $500,000 from $400,000, retroactive to January 1, 2007.

The measures proposed would provide immediate tax relief for businesses, particularly for Ontario’s manufacturing and resource industries. This will help to further encourage business investment, strengthen manufacturing and enhance the province’s competitive position. See Annex II: Enhancing Ontario’s Tax Competitiveness for further details of these proposed tax cuts.

To assist manufacturers in acquiring new and advanced equipment and technologies, Ontario is paralleling the 2007 federal budget incentives related to accelerated capital cost allowances (CCA). A key incentive for manufacturers is the 50 per cent accelerated tax writeoff for investments in manufacturing and processing (M&P) machinery and equipment from March 19, 2007 until December 31, 2008. By paralleling the federal CCA measures, the Ontario Government will provide more than $400 million in tax relief over three years to manufacturers investing in the province. Ontario urges the federal government to quickly commit to extend this incentive for three more years to 2012.

The government has worked steadily to enhance the competitiveness of Ontario’s tax system. Since 2004, it has implemented or announced more than $2 billion a year in tax cuts for business when fully phased in. This support includes accelerating Capital Tax elimination to July 1, 2010 and reducing high Business Education Tax (BET) rates by $540 million when fully implemented in 2014.

Ontario’s current combined federal–provincial CIT rate for manufacturers and resource industries of 34.12 per cent is more than four percentage points below the average federal–state rate among its main trading partners, the U.S. Great Lakes States. Ontario’s rate is also lower than the current corporate tax rates in Japan, Germany and Italy.1 Once the proposed federal tax measures are fully implemented in 2012, Ontario’s combined CIT rate for manufacturers and resource industries will be even lower at 27 per cent.

Successful economies rely on a competitive tax and regulatory climate that supports innovation and economic growth. Modern and flexible regulation that promotes public policy goals while reducing compliance burdens can unleash the growth potential of Ontario businesses of all sizes. Ontario will continue to bring forward ways to reduce the regulatory burden on businesses to help them thrive in today’s competitive global economy.

AG: Economic value added or EVA ®

Economic value added or EVA® is a measure of the true economic profit of a company. Although in a sense it is nothing more than the traditional, commonsense idea of “profit”, it makes a clear separation from dubious accounting adjustments that may occur (remember ENRON, which for a long period of time was reporting profits, while in fact was in the final approach to becoming insolvent).

EVA® is calculated as the difference between the Net Operating Profit After Tax and the opportunity cost of invested Capital. This opportunity cost is determined by the weighted average cost of Debt and Equity Capital (“WACC”) and the amount of Capital employed.

The term EVA® is a registered trademark by its developer, the consulting firm Stem Stewart & Company, since 1994. Still, another much older term for economic value added, the Residual Cash Flow, has been also used by companies for years. These measures have their foundation in the residual income and internal rate of return, concepts developed in the 1950s and 1960s. Residual income was originally developed and used by General Electric (GE) to measure performance, and was popularized by McKinsey & Company as economic profit (Carton, Hofer, 2006).

Unlike other measures, EVA® can be calculated at divisional level (i.e. Strategic Business Units), can be used for performance evaluation over time, as it is a flow, and it captures the period-by-period value creation or destruction of a given firm or investment and thus makes it easy to audit performance against management projections.

EVA® can also be used for corporate valuation and equity analysis, motivating the managers and setting organizational goals.

Even though it is a much appreciated indicator, it also has some limitations. EVA® overemphasizes the need to generate immediate results and therefore it doesn’t stimulate investments in innovative products or process technologies. Also, when calculated at the divisional level of a company, it does not control for size differences, and a larger plant or division will tend to have a higher value than its smaller counterparts.

Taking into consideration the usefulness of EVA® , many companies have adopted it as part of a comprehensive management and incentive system, which leads their decision processes.

AG: Changing our economic base – a long, slow process

Changing and expanding the Territory's economic base is a challenge. Canberra as the national capital was designed to have federal government business as its economic base. However, self-government in March 1989 brought with it an onus on the ACT Government to create and manage its own economy.
In terms of gross value added by various industry sectors, government administration and defence continue to be the largest industries in the ACT (contributing 31% of current price Gross State Product, above its long-term average of around 28%), followed by property and business services, ownership of dwellings and construction. Figure 1 demonstrates the relative contributions over a 10-year period.
Figure 1: ACT industry value added contribution to current price Gross State Product, 2006–07
Note: includes Agriculture, forestry and fishing, Mining, Manufacturing, Wholesale trade and Taxes less subsidies on products; Source: Australian Bureau of Statistics 2007c

The major non-government industries are all strongly related to property, construction and land development.

The 2005–06 review of the ACT public sector and services also acknowledged that continued above average public spending on the back of, among other things, proceeds of land sales, is not sustainable. The government's intention with the review was to achieve structural reform to reduce expenditure, accompanied by revenue measures, so that land-based revenues would be a decreasing proportion of the overall revenues in the future (ACT Government 2007a:17).

Land-related economic activity has consequences outside of economic growth, leading to loss of significant biodiversity (see Conserving biodiversity issue). However, Commonwealth and ACT legislation are in place to protect biodiversity.

A recent example is the proposed residential development in the Molonglo Valley. The Spatial Plan, adopted as part of the Canberra Plan in March 2004, identified land for future residential development in the short-, medium- and long-term. Propelled by demand, particularly in the latter part of the reporting period, the ACT Government made a concerted effort to release land for housing. As part of this program, development of the Molonglo Valley, identified initially in the Spatial Plan as a possible future urban area over the next 30 years, has been brought forward. While some of that proposed development will involve conversion to residential land of pine forest that had been burned in the January 2003 bushfire, other parts of it may affect threatened wildlife habitat unless a satisfactory resolution can be achieved. This reinforces the need for planning to be strategic, regionally focused and based on sustainability principles.

The ACT private sector is characterised by large numbers of small and micro business (Small Business Commissioner 2006, see About the data). The Australian Bureau of Statistics estimates at the time suggested small and micro-sized firms in Canberra accounted for around one-third of the Territory's total workforce, and represented over 96% of all private sector firms.

The Chief Minister's annual Export Awards highlight successful business ventures in the ACT (see www.business.act.gov.au). In January 2007 the ACT Government released a new business prospectus, Investing in Australia's Capital, designed to assist business development and investment in the ACT.

Actions to support private business, such as the Canberra Commercialisation Council, the ACT Exporters' Network and the 'Live in Canberra' campaign, have received strong support from the Canberra Business Council. In its annual report for 2005–06, the council acknowledged the benefits of the ACT Exporters' Network in establishing links with other strategic groups such as Austrade, the Australian Institute of Export and Australian Business Limited to harness opportunities to grow the Territory's export community.

The Canberra Business Council also strongly promotes the interdependence between the Territory and its neighbours in the Australian Capital Region as a way forward.

AG:The Relationship Economy: Value Creation Factors

Most intangible asset measurements have been top-down: Investors theorize a contributing factor and then try to figure out how to measure it. Studies have been performed using different approaches to determine such value.

What has been developed is now known as EVA, or economic value added.

Some perceived value drivers translate into market value; others do not.

It suggests that in the connected economy, connections matter. Alliances are incredibly, even decisively, important.

HERE’S WHAT DRIVES VALUE (IN RANK ORDER):

Studies have shown a set of value drivers for Internet companies, because in no other industry are accounting values less relevant in explaining market capitalization. These drivers were culled from a stand-alone studies Forbes did on e-commerce firms. Here’s their list, in order of importance:

(1) alliances, (2) innovation, (3) eyeballs (usage traffic), (4) brand investment, (5) stickiness (minutes spent on Web pages).

Three categories had substantial effects on e-commerce market values. The most important was the number of alliances and alliance partners. Investments in innovation (captured by research and development and capital expenditures) ranked close behind. Perhaps the most widely discussed driver of e-commerce value—the number of “eyeballs” viewing a Web site—was measured by using data on a site’s visitors, reach, or market share, and the number of hyperlinks to other sites.

Forbes found that a high visitor count also was strongly associated with market values, supporting the push by e-commerce companies to drive traffic through their sites at almost any cost. Taken together, these three category relations indicate that the strength of an e-commerce company’s network—both in connections to its customers and alliances within its economic web of suppliers and other partners—has a profound effect on a firm’s value.

By contrast, investment in building brand awareness has no statistical association with market values. So much for those millions spent on Super Bowl ads. Big marketing campaigns may boost the egos of company executives, but the research suggests they do little to raise a firm’s value. Equally surprising, “stickiness”—vaunted as the next competitive step after eyeballs—proved only a minor contributor to value. This analysis was completed in the year 2000[i]

So what does this all mean to us as individuals? For individuals involved in the networked economy, it provides a set of levers that, if effectively applied, can prepare you for individual performance and increase in market value.Consider what we do with the medium of social networking and the related emergence of adoption. What are the attributes of participation within adult and business communities leveraging social networks as the medium? It appears obvious that the attributes closely match the drivers of value defined in the older study by Forbes. These include:

alliances with others for both personal and professional gains
innovation, our collective communities repeatedly fine news ways to leverage the medium
eyeballs, Have you noticed the craze for expanding ones quantity and quality of connections and viewers to your blog post?
brand investment, whether our businesses or us as individuals we investing time to build our brand for future opportunities
stickiness- time spent on our profiles and in our communities reviewing our content

As time goes by, a model will evolve to identify new value-creation drivers, while maintaining enough flexibility to adapt to the constantly changing nature of the companies and individuals that are producing value in the connected economy, The Relationship Economy. Our individual strategies should be aimed at thinking through what value we can create and exchange with other individuals and communities as a whole.

The definition of ones value is the critical answer which facilitates the five drivers of value previously mentioned. When you define your value offering and how it can be leveraged through the medium of social networks you have defined a new means for wealth creation.

Today developers and networking platform operators are capturing the economic values. Tomorrow, when individuals define their value and unite with a purpose, the economic gains will be afforded to the users who leverage the five drivers of value creation. The shift will create The Relationship Economy and it will disrupt markets globally.

Thursday, August 19, 2010

AG: Structure and Development of the Economy

With its strategic location at the doorway to the Mainland and on the international time zone that bridges the time gap between Asia and Europe, the HKSAR has been serving as a global centre for trade, finance, business and communications. Hong Kong is now ranked the 11th largest trading entity in the world. It operates the busiest container port in the world in terms of throughput, as well as one of the busiest airports in terms of number of international passengers and volume of international cargo handled. In addition, it is the world's 12th largest banking centre in terms of external banking transactions, and the seventh largest foreign exchange market in terms of turnover. Its stock market is Asia's second largest in terms of market capitalisation.

Hong Kong is characterised by a high degree of internationalisation, business-friendly environment, rule of law, free trade and free flow of information, open and fair competition, well-established and comprehensive financial network, superb transport and communications infrastructure, sophisticated support services, and a skilled and well educated workforce complemented by a pool of effective and enterprising entrepreneurs. Added to these are the substantial amount of fiscal reserves and foreign exchange reserves, a fully convertible and stable currency, and a simple tax system with a low tax rate. On these virtues, Hong Kong is widely regarded as amongst the freest and most competitive economies in the world. The US Heritage Foundation ranks Hong Kong as the world's freest economy for the 10th year in a row in 2004. The Cato Institute of the United States, in conjunction with the Fraser Institute of Canada and other research bodies around the world, also consistently ranks Hong Kong as the freest economy in the world.

Over the past two decades, the Hong Kong economy has more than doubled in size, with GDP growing at an average annual rate of 5.0 per cent in real terms. This outpaces considerably the growth of the world economy and the Organisation for Economic Cooperation and Development (OECD) economies. Over the same period, Hong Kong's per capita GDP doubled at constant price level, giving an average annual growth rate of 3.7 per cent in real terms. At US$23,300 in 2003, this per capita GDP was amongst the highest in Asia, next only to Japan (Chart 1).
In line with increased external orientation of the Hong Kong economy, trade in goods expanded by eight times and trade in services by almost three times in real terms over the past two decades. In 2003, the total value of visible trade (comprising re-exports, domestic exports and imports of goods) reached $3,543 billion, corresponding to 287 per cent of GDP. This was distinctly larger than the ratios of 156 per cent in 1983 and 230 per cent in 1993. If the value of exports and imports of services is also taken into account, the ratio is even greater, at 331 per cent in 2003, as compared to 192 per cent in 1983 and 267 per cent in 1993.

Chart 1

Gross Domestic Product
(year-on-year rate of change in real terms)
Over the past two decades, the Hong Kong economy grew at an average annual rate of 5.0 per cent in real terms, outpacing the corresponding growth rate of 2.8 per cent for OECD economies as a whole. In 2003, the economy still attained a 3.3 per cent growth in real terms, despite the impact of SARS.

As another indication of the high degree of external orientation, the stock of inward direct investment in Hong Kong amounted to $2,622 billion in market value at end-2002, equivalent to 208 per cent of GDP. Hong Kong is the second most favoured destination for inward direct investment in Asia, next only to the Mainland. The corresponding figures for the stock of outward direct investment in Hong Kong were likewise substantial, at $2,413 billion and 192 per cent of GDP, much larger than those for many other economies in Asia. As a major financial centre in the region with huge cross-territory fund flows, Hong Kong's external financial assets and liabilities were also substantial, at $8,033 billion and $5,355 billion respectively at end-2002. The corresponding ratios to GDP in that year were 638 per cent and 425 per cent. Reflecting Hong Kong's sound international investment position, net external financial assets amounted to $2,677 billion at end-2002, equivalent to 213 per cent of GDP. As to gross external debt, which is the sum of the non-equity liability components in international investment, it stood at $2,803 billion at end-2003, equivalent to 227 per cent of GDP. Yet a major proportion of it arose from normal operations of the banking sector, and the Government incurred no external debt at all.

The Gross National Product (GNP), comprising GDP and net external factor income flows, stood at $1,269 billion in 2003. This was higher than the corresponding GDP by 2.8 per cent, owing to sustained net inflow of external factor income. In gross terms, inflows and outflows of external factor income remained substantial in 2003, at $329 billion and $294 billion respectively, equivalent to 27 per cent and 24 per cent of GDP. This was related to the huge volume of both inward and outward investment in Hong Kong.
Contributions of the Various Economic Sectors

Primary production (including agriculture, fisheries, mining and quarrying) is insignificant in Hong Kong, in terms of both value added contribution to GDP and share in total employment. This reflects the predominantly urbanised nature of the economy.

Secondary production (comprising manufacturing, construction, and supply of electricity, gas and water), which constituted a significant contributor to GDP up to the early 1980s, has diminished in relative importance since then. Within this broad sector, the value added contribution from manufacturing shrank from 21 per cent in 1982 to 14 per cent in 1992 and distinctly more to only 5 per cent in 2002, consequential to ongoing relocation of the more labour-intensive production processes to the Mainland. For the construction sector, its contribution to GDP edged lower from 7 per cent in 1982 to 5 per cent in 1992, and further to 4 per cent in 2002. As to supply of electricity, gas and water, the corresponding share held relatively stable, at around 2-3 per cent over the past two decades.

The open door policy and economic reform in the Mainland have not only provided an enormous production hinterland and market outlet for Hong Kong's manufacturers, but have also created abundant business opportunities for a wide range of service activities. These activities include specifically freight and passenger transport, travel and tourism, telecommunications, banking, insurance, real estate, and professional services such as financial, legal, accounting and consultancy services. In consequence, the Hong Kong economy has become increasingly service-oriented since the 1980s.

Reflecting this, the share of the tertiary services sector (comprising the wholesale, retail and import/export trades, restaurants and hotels; transport, storage and communications; financing, insurance, real estate and business services; community, social and personal services; and ownership of premises) in GDP went up visibly, from 69 per cent in 1982 to 79 per cent in 1992 and further to 88 per cent in 2002 (Chart 2).

The profound change in the economic structure was also borne out by a broadly similar shift in the sectoral composition of employment. Over the past two decades, the share of the services sector in total employment followed a continuous uptrend, rising distinctly from 52 per cent in 1983 to 73 per cent in 1993 and further to 85 per cent in the first three quarters of 2003. On the other hand, the corresponding share for the manufacturing sector kept on shrinking, from 38 per cent in 1983 to 18 per cent in 1993 and further to only 5 per cent in the first three quarters of 2003 (Chart 3).

The services sector has not only flourished but also diversified in types of activities, concomitant with the structural transformation of the economy. Trade-related and tourism-related services, community, social and personal services, and finance and business services such as banking, insurance, real estate and a host of related professional services, have all grown distinctly over the past two decades. Strong expansion was also observed in information technology in the more recent years, especially those pertaining to telecommunications services and Internet applications, in line with the shift in economic structure more towards knowledge-based activities.

Chart 2

Gross Domestic Product by broad economic sector
Along with a profound shift in economic structure, the share of the tertiary services sector in GDP continued to increase, while the share of the secondary sector dwindled further over the past two decades.

Chart 3
Employment by broad economic sector
Consequential to the ongoing relocation of the less skill-intensive and lower value added manufacturing processes to the Mainland, as well as the strong growth in service activities in Hong Kong, the tertiary services sector has expanded markedly and has overtaken the secondary sector to become the largest employer in the economy since 1981.
* Average of Q1 to Q3 2003.

On trade in services, exports and imports of services both grew by an annual average of 7 per cent in real terms over the past two decades. In 2002, civil aviation, travel and tourism, trade-related services, and various financial and banking services were the largest components of trade in services. Within exports of services, offshore trading and merchandising services have overtaken transportation as the most important component in 2002, accounting for 35 per cent of the total value in that year. For transportation, the corresponding share was 30 per cent. This was followed by travel and tourism (with a share of 17 per cent), and financial and banking services (6 per cent). As to imports of services, travel and tourism remained the largest component, accounting for 50 per cent of the total value in 2002. Transportation was in the second place (with a share of 26 per cent), followed by offshore trading and merchandising services (7 per cent), and financial and banking services (3 per cent).

Net output or value added of the services sector as a whole rose visibly, by an annual average of 6 per cent in value terms between 1992 and 2002. Amongst the major constituent sectors, net output of community, social and personal services had the fastest growth (at an average annual rate of 9 per cent). This was followed by transport, storage and communications (6 per cent); the wholesale, retail and import/export trades, restaurants and hotels (5 per cent); and financing, insurance, real estate and business services (4 per cent).
In terms of value added contribution to GDP, the wholesale, retail and import/export trades, restaurants and hotels continued to be the largest in 2002, with a share of 27 per cent. This was followed by community, social and personal services (22 per cent), financing, insurance, real estate and business services (22 per cent), and transport, storage and communications (11 per cent) (Chart 4).

Chart 4

Gross Domestic Product by major service sector
Over the past two decades, community, social and personal services had a more distinct increase in net output than other major service sectors. Yet ranked in terms of value added contribution to GDP, the wholesale, retail and import/export trades, restaurants and hotels remained the largest service sector in 2002.
In terms of employment, the wholesale, retail and import/export trades, restaurants and hotels was again the largest sector, accounting for 31 per cent of the total employment in the first three quarters of 2003. This was followed by community, social and personal services (with a share of 28 per cent), financing, insurance, real estate and business services (15 per cent), and transport, storage and communications (11 per cent) (Chart 5).

Chart 5

Employment by major service sector
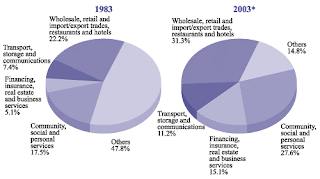

Over the past two decades, financing, insurance, real estate and business services showed the fastest employment growth. But in terms of employment size, the wholesale, retail and import/export trades, restaurants and hotels continued to be the largest employer in the economy in 2003.
* Average of Q1 to Q3 2003.

The Manufacturing Sector

Manufacturing firms in Hong Kong are renowned for their versatility and flexibility in coping with changing demand conditions in the overseas markets. Moreover, through increased outward processing arrangements in the Mainland, Hong Kong's productive capacity has effectively been expanded by multiples, which has helped uphold the price competitiveness of its products.

Besides relocating the more labour-intensive production processes to the Mainland, Hong Kong's manufacturers have also been striving hard to diversify their products and markets, in face of the challenges from globalisation of trade and keen competition from other export producers. Concurrently, productive efficiency and product quality have been continuously upgraded by incorporating more advanced skills and technology.

Within the local manufacturing sector, textiles and clothing remain the most important industries, notwithstanding continued decline in their relative significance over the years. Other major industries include machinery and equipment, electronics, printing and publishing, food processing and metal products. Generally speaking, those manufacturing operations still remaining in Hong Kong are more knowledge-based with a higher value added and a greater technology content. Between 1993 and 2003, labour productivity in the local manufacturing sector, as measured by the ratio of the industrial production index to the manufacturing employment index, rose visibly, by an annual average of around 6 per cent.

In 2003, the United States and the Mainland were the two largest markets for Hong Kong's domestic exports, accounting for 32 per cent and 30 per cent respectively of the total. Other major markets included the United Kingdom (6 per cent), Germany (4 per cent), Taiwan (3 per cent), Japan (2 per cent), and the Netherlands (2 per cent). In the more recent years, new markets have been developed for Hong Kong's exports, including markets in the Middle East, Eastern Europe, Latin America and Africa.

Increasing Economic Links between the HKSAR and the Mainland

Since the Mainland adopted its economic reform and open door policy in 1978, economic links between Hong Kong and the Mainland have gone from strength to strength. This has brought substantial economic benefits to both places.

Visible trade between Hong Kong and the Mainland has expanded rapidly since 1978, at an average annual rate of 22 per cent in value terms. But the pace of growth moderated in the more recent years, to an annual average of 8 per cent during 1993-2003, partly due to increased direct shipment of goods into and out of the Mainland upon enhancement of port facilities and simplification of customs procedures there. The Mainland remained Hong Kong's largest trading partner in 2003, accounting for 43 per cent of the total trade value in Hong Kong. The bulk (specifically, 91 per cent) of Hong Kong's re-export trade was related to the Mainland, making it the largest market for as well as the largest source of Hong Kong's re-exports. Reciprocally, Hong Kong was the Mainland's third largest trading partner in 2003 (after Japan and the United States), accounting for 10 per cent of the Mainland's total trade value (Chart 6).

In the more recent years, there has been an increasing shift in the mode of Hong Kong-Mainland trade from re-exports to offshore trade. Between 1990 and 1995, Hong Kong's exports of trade-related services grew at an annual average rate of 5 per cent in real terms, much slower than the growth in re-exports involving the Mainland, at an annual average rate of 22 per cent. The growth pattern was reversed during 1995 to 2003, when exports of trade-related services surged at an average annual rate of 15 per cent in real terms, outpacing the growth in re-exports involving the Mainland, at an average annual rate of 7 per cent.

Over the past two decades, there has also been a sharp increase in people, service and investment flows between Hong Kong and the Mainland. Hong Kong is a major service centre for the Mainland generally and South China in particular, providing a wide array of financial and other business support services like banking and finance, insurance, transport, accounting and sales promotion.

Hong Kong is also a principal gateway to the Mainland for business and tourism. Between 1993 and 2003, the number of trips made by Hong Kong residents to the Mainland grew at an average annual rate of 9 per cent to 53 million trips, and the number of trips made by foreign visitors to the Mainland through Hong Kong at an average annual rate of 4 per cent to 2.7 million trips. Yet, mainly due to the outbreak of SARS in the region in the first half of the year, these two particular types of trips decreased by 6 per cent and 21 per cent respectively in 2003.

Chart 6

Visible trade between Hong Kong and the Mainland
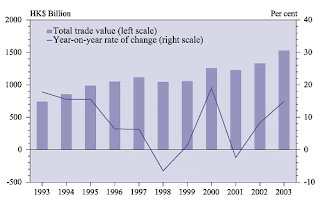
Since the Mainland adopted its economic reform and open door policy in 1978, there has been a rapid expansion in merchandise trade, especially re-export trade, between Hong Kong and the Mainland.

Moreover, Hong Kong is a major source of external direct investment in the Mainland. The cumulative value of Hong Kong's realised direct investment in the Mainland amounted to US$218 billion at end-September 2003, accounting for about half of the total inward direct investment there. Over the years, there has been a noticeable shift in the composition of Hong Kong's direct investment across the boundary, from industrial processing to a wider spectrum of business ventures, such as hotels and tourist-related facilities, real estate and infrastructure development. Relative to other places in the Mainland, Hong Kong's economic links with Guangdong are the most intimate. At end-2002, the cumulative value of Hong Kong's realised direct investment in Guangdong was US$86 billion, accounting for 69 per cent of its total inward direct investment. According to a survey conducted by the Federation of Hong Kong Industries in December 2003, 11 million Mainland workers were employed directly or indirectly in the Mainland by industrial ventures with Hong Kong interests, of whom 10 million were in Guangdong. This is about 57 times the size of Hong Kong's own manufacturing workforce.

In the opposite direction, there has likewise been a sizeable flow of investment capital from the Mainland to Hong Kong over the past years. By end-2002, the Mainland had invested a total of US$76 billion in Hong Kong, making it the largest source of external direct investment here. Over 2 000 Mainland enterprises currently operate in Hong Kong, with total assets amounting to US$220 billion. Mainland enterprises take up a significant role in such major economic sectors as banking, insurance, shipping and tourism, reportedly accounting for about 25 per cent of the market shares in those sectors. Mainland enterprises also maintain high investment stakes in other lines of business such as the import/export trade, the wholesale/retail trade, warehousing, real estate and infrastructure development.

In tandem with the upsurge in cross-boundary business activities, financial links between Hong Kong and the Mainland have strengthened substantially over the past years. Hong Kong's authorised institutions' external claims on and liabilities to entities in the Mainland were generally on the rise over the period. Comparing end-2003 with a year earlier, external liabilities of Hong Kong's authorised institutions to entities in the Mainland grew by 13 per cent to $326 billion, and their external claims on entities in the Mainland even faster by 41 per cent to $179 billion.

The Bank of China (Hong Kong) Limited is the second largest banking group in Hong Kong, after the HSBC Group. It is also one of the note-issuing banks in Hong Kong, besides the Hongkong Bank and the Standard Chartered Bank. As to the other three state-owned commercial banks, namely the China Construction Bank, the Agricultural Bank of China, and the Industrial and Commercial Bank of China, they have all been granted banking licences to operate in Hong Kong since 1995. On the other hand, the HSBC Group, the Bank of East Asia and the Standard Chartered Bank are amongst the best-represented foreign banks in the Mainland.

Hong Kong has been serving as a major funding centre for the Mainland. Besides being a direct source of funds, it also provides a window through which foreign funds can be channelled efficiently into the Mainland for financing development projects there. While syndicated loans remain the most important means for Mainland-related enterprises to raise funds in Hong Kong, issuance of securities has become increasingly popular in the more recent years. In 2003, listing activities by Mainland enterprises continued to be a prominent feature in Hong Kong's stock market, especially so in the latter part of the year when the market staged a visible upturn amidst improved investor sentiment. By end-2003, a total of 64 state-owned enterprises in the Mainland had been listed on the Main Board of Hong Kong's stock market, raising a total equity capital of $191.3 billion. Amongst them, 10 were listed in 2003, raising $46.8 billion. In addition, another 72 non-state-owned Mainland enterprises had likewise been listed by end-2003, raising a total equity capital of $590.4 billion. Of these, one was listed in 2003, raising $4.7 billion. On the Growth Enterprise Market, there were 28 state-owned enterprises, raising a total equity capital of $4.0 billion. All these listings have helped broaden the base of Hong Kong's stock market, and entrench further Hong Kong's position as a major fund raising centre in the region.
The signing of CEPA on June 29, followed by the signing of its six Annexes on September 29, serve to expand further business opportunities between Hong Kong and the Mainland, by enlarging the scope for cross-boundary trade, service and investment flows. Under CEPA, the Mainland will accord zero tariff as from January 1, 2004 for exports from Hong Kong meeting the rules of origin requirement in 374 Mainland product codes. On services, Hong Kong companies will be allowed to have earlier entry and wider market access, as well as to form wholly-owned or majority-owned subsidiaries in 18 service sectors in the Mainland. CEPA also facilitates trade and investment between Hong Kong and the Mainland through promoting cooperation in customs clearance, electronic commerce, transparency in laws and regulations, and other procedures.

With continuing reform and liberalisation of the Mainland economy, particularly after China's entry into the World Trade Organisation, more foreign investment can be expected to flow into the Mainland. Hong Kong's service hub role for the Mainland will continue to strengthen. Hong Kong possesses a strong niche in partnering with as well as in providing various business support services to foreign enterprises seeking to enter the Mainland market. In the other direction, as more Mainland enterprises seek to extend their business outward, Hong Kong can also help them to gain access to the overseas markets.


AG: International Growth Highlights Wal-Mart's 2Q

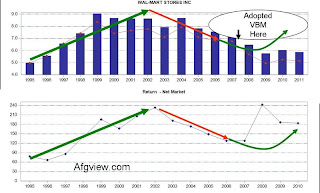
We own WalMart (WMT) because it adopted value-based management a few years back. It made return on invested capital its overarching objective. The result was a change in strategy. Instead of driving sales growth by investing vast amounts in new stores in already saturated markets, WMT cut back on domestic capital spending and drove US productivity.
It also exited markets like Germany where expected returns were below its cost of capital. The growth would come from the fast growing emerging markets of China and South America. Those are the places that very profitable growth continues as was reported in today's earnings release. From Morningstar $$:
Wal-Mart's competitive advantages and everyday low pricing strategy will stand under any operating environment. Moreover, as Wal-Mart gains traction in several high-growth markets such as Mexico, China, and Brazil, the international segment will become an increasingly critical component of our valuation assumptions. Trading at less than 13 times our forward earnings estimate and an enterprise value/EBITDA under 7 times, Wal-Mart shares look attractive.

Using excess cash flow to reduce shares outstanding has added about 2% to EPS growth since 2005. With recession over in its business, WMT has stepped up buying shares so the increased ownership for existing shareholders will add about 4% to EPS growth.

Intrinsic Value

In the graph below we see WalMart's intrinsic value (red line) as measured by afgview.com's default model matched up against share price (the blue columns). You can see the increasing gap between a rising intrinsic value and falling or at best stagnant stock price. These are widening gaps give us our margin of safety. We can see that after the recession '08-09, the gap is beginning to widen again.

We are Long WMT until price catches up to its increasing intrinsic value per share.